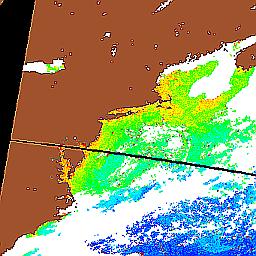
The left image shows the chlorophyll a on the U.S. East Coast from the SeaWiFS instrument on the SeaStar satellite. Yellow and red colors represent higher chlorophyll, dark blue colors represent lower chlorophyll and brown is land. The right image shows a map of the area covered in the left image. The image is a composite from November 4, 2001 to November 5, 2001. (Courtesy of the SeaWiFS Project, NASA/Goddard Space Flight Center and ORBIMAGE,
http://seawifs.gsfc.nasa.gov/SEAWIFS.html)
(Return to "How do we measure chlorophyll a?"). |