 | ||||
 |
Estuarine ScienceSeasonal and Daily CyclesThe water properties of Narragansett Bay are constantly changing. One of the reasons to monitor the Bay is to measure these constant changes and look for patterns. Many of the changes in Narragansett Bay follow a pattern and change on a certain time scale. Some of the cyclic changes are illustrated below. Yearly Cycles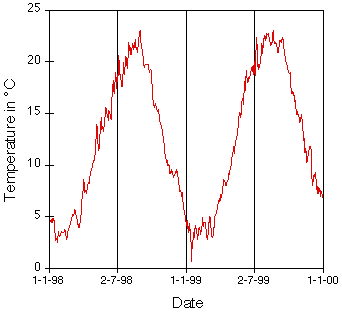 Data courtesy Dr. Dana Kester, URI. The image above shows the water temperature in Narragansett Bay over a two year period, January, 1998 to December, 1999. The water is warmest during August and coldest in January or February. The water cools rapidly in September, October and November and warms rapidly in April and May. Contrast the water temperature with the air temperature in the graph below of monthly average air and water temperature. The highest air temperature is in July and the lowest air temperature is in January. The highest water temperature is in August and the lowest water temperature is in February (slightly colder than January). 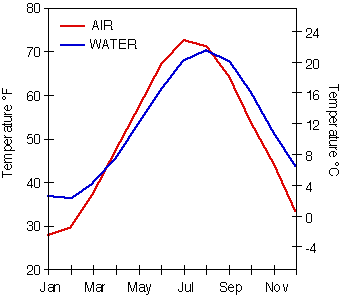 Data from National Weather Service and Dr. Dana Kester Daily CyclesMany water properties change on a daily basis. One cause of daily changes is the day-night change in phytoplankton growth. Phytoplankton need the sunlight during the day to grow. The graph below shows chlorophyll a and dissolved oxygen in the surface water for October 15, 2000 in upper Narragansett Bay (Bullock Reach). The dissolved oxygen and chlorophyll begin increasing at the same time. They both start increasing at sunrise as the phytoplankton begin photosynthesizing and producing oxygen. In mid-afternoon the chlorophyll a starts decreasing and continues decreasing after sunset. Oxygen also decreases after the chlorophyll begins decreasing. Other factors such as wind may also play a role in the oxygen levels. 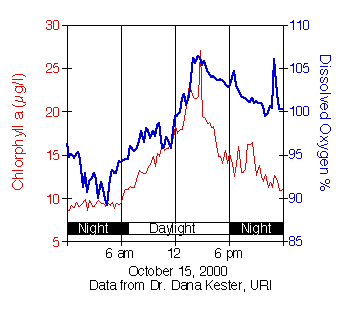 Tidal CyclesThe tides slosh water back and forth in Narragansett Bay. The water properties will change over a tidal cycle as the surface water gets moved up and down the Bay. The graph below shows the temperature (red) and salinity (blue) at Pomham Rocks in March of 2000. The Blackstone River was above flood stage for several days. The black line represents the tidal cycle. The temperature and salinity are changing dramatically with the tidal cycle. As the tide ebbed (flowed out), it brought colder, fresher water from the river to Pomham Rocks. When the tide rises, it brings warmer, saltier water from the Bay to Pomham Rocks. This is an extreme example of tidal changes. 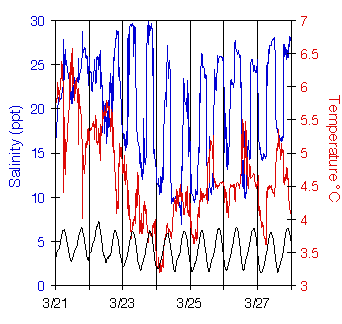 The graph below shows the temperature (red) and salinity (blue) in November 2000 in the Providence River. The black line is the tide cycle. The salinity and temperature change a little with the tidal cycle. This graph shows the typical changes that occur over a tidal cycle. Note the difference in scale between this graph and the graph above. 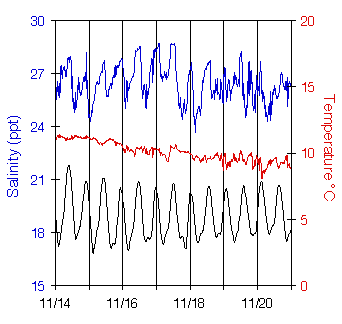
|
|||